By Greg Nowak. Updated 24 September 2026.
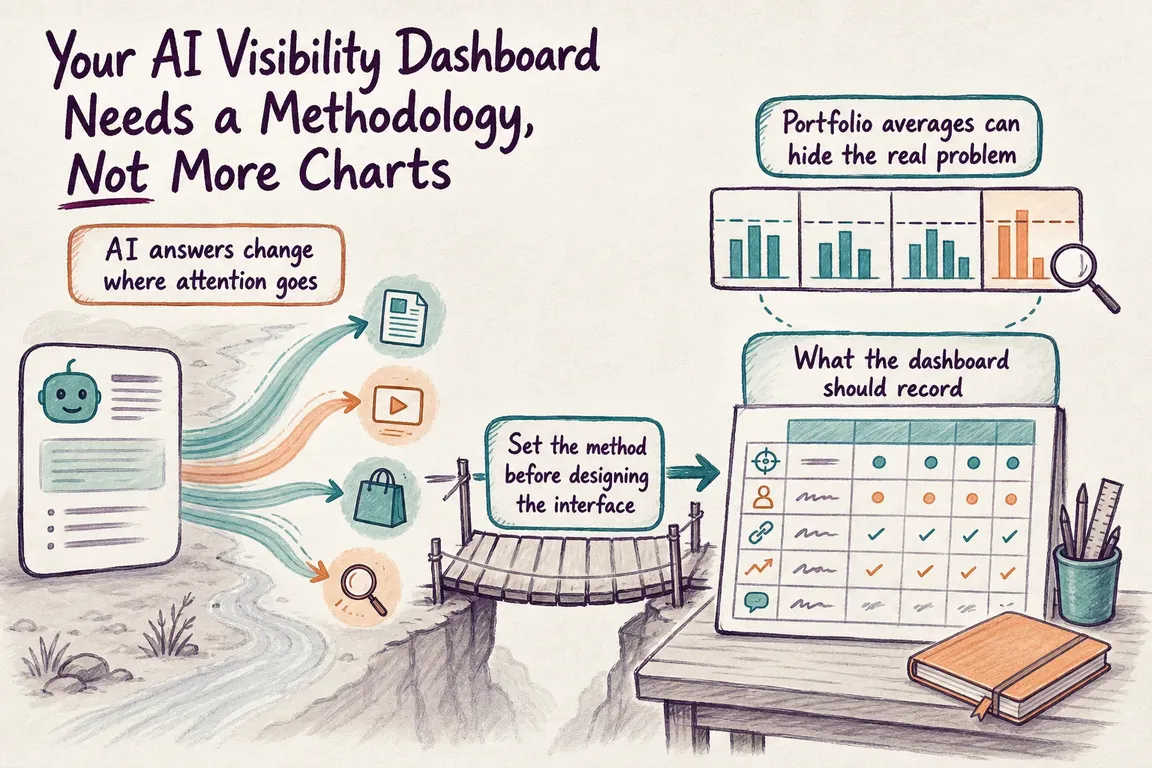
An AI visibility dashboard can look authoritative while resting on surprisingly weak evidence. A line rises, a competitor moves ahead, or a percentage drops—but was that caused by your content, a changed prompt, a different model, a new interface, or ordinary variation between responses?
If the dashboard cannot answer that question, it should not be steering budgets. Business owners and agency teams need a measurement system that shows where a brand appears, preserves the evidence, and makes uncertainty visible.
Start with the decision, not the dashboard
Define what someone should be able to decide after reading the report. A content lead may need to identify buyer questions that lack a useful first-party page. A communications team may want to know which independent publications influence recommendations. Operations may be investigating crawler access, while management wants evidence that visibility is contributing to enquiries or revenue.
These are different questions. They require related data, but not one blended “AI visibility score.” A brand mention, a citation, a recommendation, a visit, and a conversion represent different stages of the journey.
That distinction matters even more now that platform-native reporting is improving. Google rolled out dedicated generative-AI performance reports in Search Console worldwide in August 2026. They show impressions, pages, countries, devices, and dates for appearances in Google’s generative search features. This is useful first-party telemetry, but it does not replace controlled testing across buyer questions or explain how other assistants describe your business.
Use separate metrics for separate outcomes
| Layer | Record | Decision it supports |
|---|---|---|
| Technical access | Crawler, URL, response status, robots treatment, timestamp | Can the platform reach the material? |
| Platform visibility | Native impressions, appearing pages, country, device, date | Where does the platform report exposure? |
| Observed answer | Prompt, response, engine, interface, locale, run, timestamp | What did a controlled test actually produce? |
| Mention | Brand occurrence and surrounding passage | Is the brand present and in what context? |
| Citation or link | Domain, URL, position and supported claim | Which sources underpin the answer? |
| Recommendation | Explicit inclusion, comparison, qualification and sentiment | Is the brand merely named or actively proposed? |
| Business response | Referral, landing page, conversion and lead quality | Did visibility produce useful commercial activity? |
OpenAI, for example, says referral URLs from ChatGPT search include utm_source=chatgpt.com. That gives analytics teams a useful attribution signal. It still does not reveal every answer in which a page appeared, and crawler activity alone does not prove that the page was cited.
Research on citation auditing makes another important distinction: retrieval and citation are separate processes. In practice, most organisations cannot observe every document an external system retrieved. Record a citation when it is visible, and label retrieval as unknown unless the platform or your own system exposes reliable evidence. Do not convert an assumption into a metric.
Freeze a prompt set you can compare
Create a baseline inventory of real buyer questions. Classify each prompt by market, language, service or product, journey stage, and intent. Include the questions prospects ask before making contact—not only variations of your preferred keywords.
Keep that baseline stable for trend reporting. If the business adds a market or discovers an important new question, add a versioned cohort rather than silently changing the old set. Otherwise, an apparent improvement may simply reflect easier prompts.
The basic observation should be one prompt, on one platform, in one interface and locale, at one time, with one run number. Repeat tests because generated responses vary. Store the complete response before extracting mentions and citations; screenshots alone are difficult to search, compare, or reclassify.
Where available, retain the displayed model or product label, account state, personalisation settings, and test location. You may not be able to control every condition, but documenting known conditions makes the limitations inspectable.
Build an evidence trail, not a quarterly mystery
A workable reporting pipeline can be modest. Start with a controlled prompt sheet, an automated or supervised collection process, raw-response storage, classification rules, and a review queue for ambiguous results. Give each observation a durable ID so a chart can lead back to its evidence.
Set a retention period and remove personal or confidential information before storing responses. Assign owners for prompt approval, classification changes, anomaly review, platform-change logs, and analytics definitions. When an engine, interface, location, or testing method changes materially, mark a break in the series instead of drawing an uninterrupted trend line through it.
Use platform reporting and controlled observations together. Search Console can now show Google generative-search visibility directly; analytics can identify attributable referrals; controlled tests can examine wording, recommendations, citations, and competitors. None provides the complete picture alone.
Report patterns that lead to action
Useful reporting highlights decisions: buyer questions with no credible supporting page, markets where recommendations are inconsistent, third-party sources that repeatedly shape answers, pages receiving visibility but no qualified traffic, or crawling problems affecting important material.
Attention research also supports treating generated answers seriously without declaring conventional links irrelevant. Microsoft’s 2026 eye-tracking study found significantly greater engagement with generative content while searchers continued to use traditional results. Your reporting should therefore cover both AI-answer exposure and the website journey that follows.
The result may contain fewer headline numbers, but each one will be easier to defend. If your team needs help defining the protocol, coordinating data owners, and turning the evidence into an operating report, Greg can help build the process with you.
Related on GrN.dk
- Google’s 2026 AI Search Guidance: SEO Still Matters, but Reporting Has Changed
- Search Console Can See Social Posts—Your Reports Need a New Map
- Google’s AI Search Toggle Is a Publishing Decision, Not an SEO Setting
Need help with this kind of work?
Build a defensible reporting process Get in touch with Greg.