By Greg Nowak. Last updated 2026-08-23.
Your most searchable content may not live on your website. It might be a YouTube video, an Instagram post or a TikTok clip. Until now, that activity sat outside the usual Search Console view, leaving a gap between what people found in Google and what marketing teams could report.
Platform properties close part of that gap. Organisations can now see how eligible Instagram, TikTok, X and YouTube accounts perform when their content appears in Google Search.
The word part matters. Each account is managed as a separate Search Console property. Access depends on account ownership and an active connection. The data covers discovery in Google, not activity inside the social platform. Bringing it all into one useful report still takes some design work.
For marketing leaders, the question is not simply, “Can we connect TikTok?” It is whether the resulting report can separate visibility, engagement and commercial outcomes without treating unlike metrics as interchangeable.
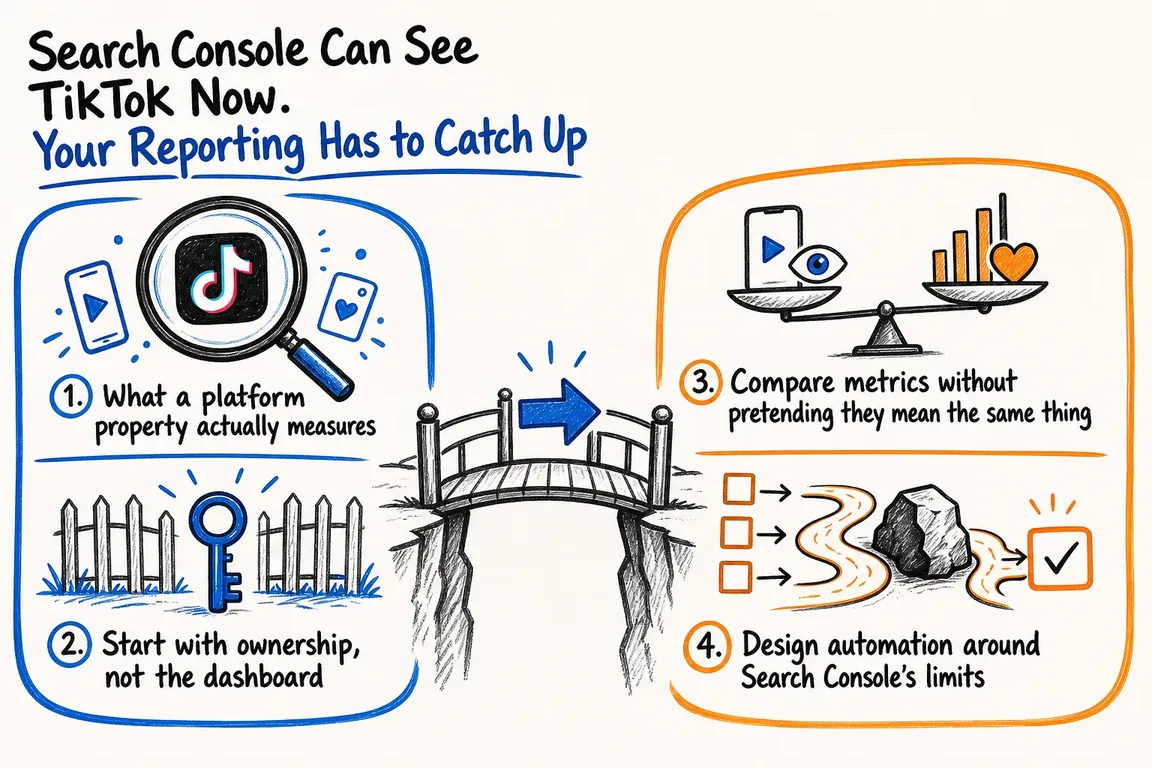
What a platform property actually measures
A platform property represents a supported social or video account rather than a domain or URL prefix. Its performance report can show clicks from Google Search, impressions, click-through rate and average position. The data can be analysed by query, page, country, device and date.
That opens up some practical lines of enquiry. Which searches surface your videos? Which posts earn visits from Google? Does the pattern change by country or device? You can now investigate those questions using the same core search concepts applied to website properties.
There is a firm boundary, though. A Search Console click is a click from a Google result to content on the platform. It is not a TikTok view, an Instagram interaction or a YouTube watch-time metric. Native analytics are still needed to understand behaviour within each network. Website analytics and lead systems are still needed to measure sessions, enquiries and commercial results.
A credible report keeps those layers separate first, then connects them where the evidence allows.
| Reporting layer | Business question | Measures to use | What the data cannot prove |
|---|---|---|---|
| Google discovery | How is Google surfacing our website and platform content? | Impressions, clicks, CTR, position and queries | Native reach, watch time or social engagement |
| Native platform | What happens after someone reaches Instagram, TikTok, X or YouTube? | Views, retention, engagements and followers | Website sessions, leads or revenue |
| Website journey | What do visitors do on pages we own? | Sessions, landing-page actions and conversions | Lead quality without supporting records |
| Commercial outcome | Did discovery contribute to useful demand? | Enquiries, qualified leads, opportunities and revenue | Single-touch causation without an attribution rule |
Start with ownership, not the dashboard
A platform property needs a connection to the relevant account, so access design comes before charts. Establish which business identity owns each profile, who can authorise the connection, who administers Search Console and how access will be handled when an employee leaves or an agency contract ends.
Google notes that each platform account is a separate property and that connections may need to be verified again. Keep a simple register with the platform, account identifier, business owner, Search Console property, authorised connector, connection date, review date and backup administrator. When access expires, the team can then treat it as a routine operational issue rather than spending days diagnosing an unexplained hole in the report.
The same discipline prevents an important reporting process from depending on one person’s login. Use organisationally controlled accounts and give appropriate access to the colleagues and partners who need it. Search Console allows up to 1,000 properties per account. Most companies will never approach that number, but agencies, multi-brand groups and organisations with large account estates should account for it in their setup. Availability was rolled out gradually, so eligibility should also be checked for each profile rather than assumed.
Compare metrics without pretending they mean the same thing
Website and platform properties share the language of Search performance, which makes comparison possible. A query, impression or click can be measured consistently as Google discovery. What happens at the destination is a different matter.
A recurring report should answer a focused set of business questions. How much Google visibility went to owned pages, and how much went to off-site content? Which non-brand searches surfaced each type of destination? Which pages or posts gained or lost clicks? Where did searchers continue to an owned landing page? Which campaigns or content themes produced enquiries that can actually be observed?
Put the definition next to every important KPI. State whether brand queries are included, which search type is selected, which countries and devices are covered, what period is being compared, and whether the data is grouped by property, page or query. Treat average position as a diagnostic trend, not as the fixed ranking of a single result.
For executives, show website and platform discovery side by side while keeping their totals separate. Analysts can then drill into queries, destinations, devices and countries. Commercial reporting should connect the journey only through evidence such as tagged links, landing-page events and lead records. If part of the path cannot be observed, call it a measurement gap. Do not hide it behind a confident attribution assumption.
Design automation around Search Console’s limits
The Search Console interface may be enough when only a few properties are involved. A recurring report across many website and platform properties will usually need exports, the Search Console API or the official Looker Studio connector. The sensible choice depends on the number of properties, the history required, the refresh schedule and the level of detail people need.
The API supports dimensions including date, query, page, country, device and search appearance. Extraction choices affect the output, however. Search Analytics returns top rows rather than guaranteeing every row, applies request limits and may produce different totals depending on the aggregation used. A highly detailed table can therefore disagree with a headline total without either figure necessarily being wrong.
Choose the grain of each dataset before building the automation. A daily property table works well for stable trend reporting. A query-by-page table is better for content analysis, but it is larger and more exposed to top-row limits. Narrower date ranges and pagination using start-row controls can retrieve more data, though they do not remove the underlying reporting boundaries.
Record the property identifier, extraction time, dimensions, filters and aggregation choice with every dataset. That small amount of metadata makes the figures reproducible when someone asks why this month’s dashboard differs from an earlier export.
Looker Studio’s official connector can speed up dashboard delivery for properties the user can access. Its permissions still follow Search Console, so the person creating the data source needs the right property access. Test the actual platform accounts and required fields before committing to a dashboard design. If the connector cannot supply the consolidated detail you need, a scheduled export or API-fed data store gives you more control.
Build a reporting rhythm that leads to decisions
The new data is useful when it changes what the team publishes or promotes. “TikTok impressions increased” is an observation, not a decision. A useful monthly report explains which search themes changed, which content drove the movement, whether the same pattern appeared on the website and what the team will do next.
The operating rhythm is straightforward. Verify connections and data freshness. Extract website and platform measures using consistent rules. Classify queries and destinations by brand, topic and campaign. Connect observable journeys to landing pages and lead systems. Then record the resulting decisions, owners and review dates.
Weekly checks can catch expired access and abrupt changes. Monthly analysis usually gives marketing teams better context for content and commercial decisions.
The awkward part is that no single team owns the whole process. It touches social account governance, SEO, analytics engineering, dashboard permissions, campaign tracking and lead reporting. A freelance digital project manager can provide the missing coordination: settle definitions, assign responsibilities, test the data path and make sure the reporting process survives beyond its first dashboard.
The opportunity is a wider view of search
Useful answers increasingly sit beyond company websites, and Search Console can now measure more of the content a business publishes. That gives teams a broader view of search visibility. It does not give them a reporting strategy out of the box.
The practical work is to establish reliable ownership, keep Google discovery distinct from native-platform performance, automate only at a defensible level of detail and connect visibility to business outcomes where evidence exists. Done well, the result is not simply another dashboard. It is a maintained process for deciding what to publish, where to publish it and how to judge its contribution.
Related on GrN.dk
- Google’s AI Search Toggle Is a Publishing Decision, Not an SEO Setting
- Agentic AI: What It Is, How It Works, and When to Use It
- AI Search Finally Has Reports. Now Connect Visibility to Revenue
Need help with this kind of work?
Build a reporting system you can trust Get in touch with Greg.