By Greg Nowak. Updated 4 October 2026.
A slow mobile menu, a heavy campaign page and an expensive CMS query can arrive as three separate audit findings. To a visitor, they may feel like one thing: the site makes them wait. For the team paying to run it, each finding may also represent work repeated on every visit.
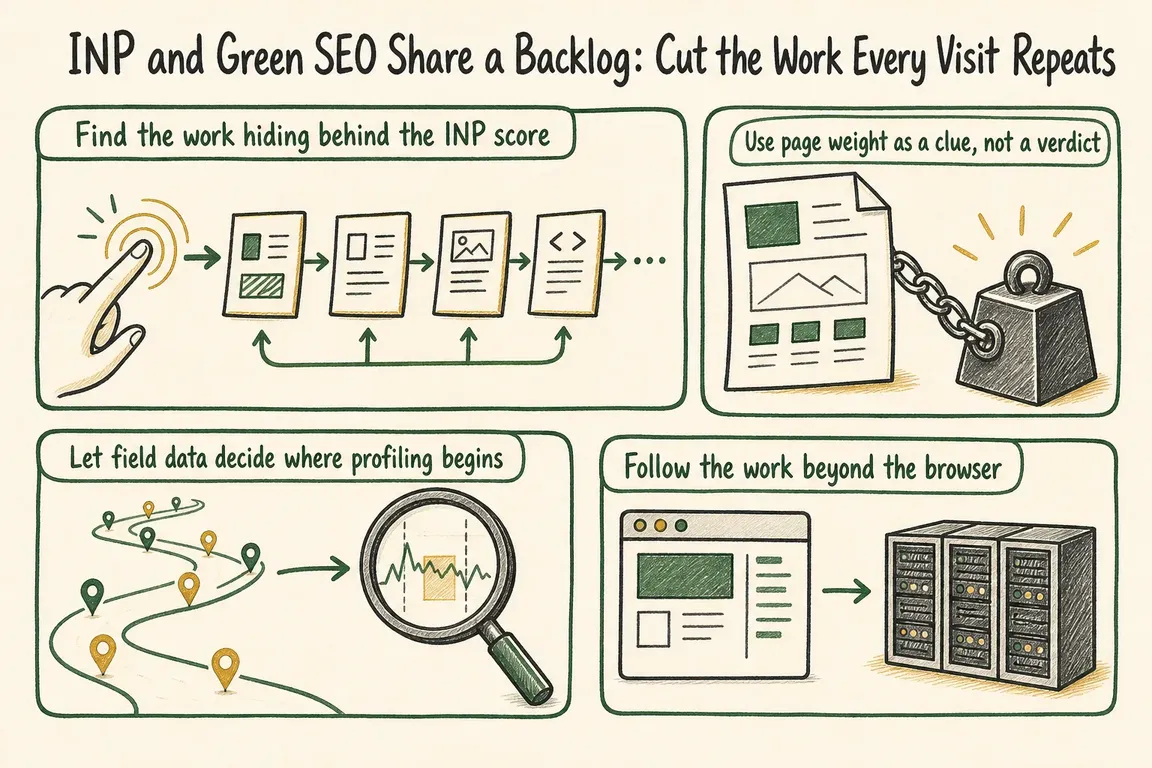
That is the useful overlap between Interaction to Next Paint (INP), technical SEO and greener web delivery. Put the evidence in one backlog so owners, developers and agencies can agree on what to fix first. Keep the measures distinct: fewer bytes do not automatically improve responsiveness, and a better INP score does not prove a lower environmental impact.
Start with the interaction customers actually feel
INP measures how quickly a page responds across qualifying interactions during a visit. According to web.dev’s INP guidance, 200 milliseconds or less at the 75th percentile is a good target, assessed separately for mobile and desktop. The score tells you that responsiveness needs attention; it does not identify the button, script or rendering task responsible.
Ask which journey is affected. Can a customer open navigation while the page loads? Does a filter respond promptly? Does a consent choice visibly take effect? Then split the slow interaction into input delay (the browser is busy before a handler starts), processing duration (the handler takes too long) and presentation delay (the next frame is slow to appear). Those three parts point to different fixes.
Keep the search claim proportionate. Google says Core Web Vitals are used by its ranking systems, while good scores alone do not guarantee top rankings. A useful ticket describes customer friction and its likely cause, rather than promising traffic from a score change.
Build the backlog from field evidence
Begin with pages and journeys that matter to the business: enquiries, purchases, account tasks or publishing workflows. Check device classes separately. The Chrome UX Report API provides aggregated real-user data for eligible URLs and origins over a rolling 28-day period. It can show where a problem is broad or persistent, but it usually cannot tell you which interaction caused it.
For that detail, use real-user monitoring that records the interaction and enough technical context to reproduce it. Avoid collecting typed text or unnecessary personal identifiers. Recreate the problem on a representative device, then inspect a browser performance trace alongside network requests, third-party scripts, cache behaviour and server timings.
| What the evidence shows | Where to investigate | Useful guardrail |
|---|---|---|
| Long input delay | Startup JavaScript, timers and third parties occupying the main thread | Trace the affected interaction after release |
| Long processing duration | Handlers doing calculations or secondary updates before the next frame | Journey-level interaction test |
| Long presentation delay | Large DOM changes, style recalculation or forced layout | Component rendering check |
| Large repeat transfer | Media size, compression, cache headers and unnecessary requests | Byte and request budgets |
| Slow CMS response | Cache misses, repeated queries and costly template rendering | Query and cache assertions |
These rows are starting points, not diagnoses. A smaller image may reduce transfer without changing a slow menu interaction. A cache improvement may speed delivery while leaving a long browser task intact. Trace the whole journey before assigning the fix.
Prioritise the work a customer encounters most
An audit can produce dozens of valid recommendations. Rank them by how often the problem occurs, whether it interrupts a valuable task, the amount of work the change could remove, confidence in the diagnosis and the risk of delivery. A recurring delay on an enquiry form may deserve attention before a larger byte saving on a rarely visited page.
Write tickets so a team can act on them. For example: “On mobile, opening the navigation during page load is delayed while the analytics bundle runs. Record the interaction trace, defer work that is not needed for the menu, then check the same journey after release.” That gives an owner, a developer and an agency the same definition of the problem. Add an expected outcome and a regression check before the ticket is accepted.
Follow repeated work through the CMS
Drupal and WordPress sites can accumulate cost behind the page: duplicate database queries, poor fragment caching, oversized generated markup or assets loaded across every template. Inspect cold and warm cache behaviour separately. Check whether a CDN is serving reusable assets efficiently, but also whether the origin is doing avoidable work to create them.
The W3C Web Sustainability Guidelines, currently a Group Note Draft, recommend measurable goals, less unused code, fewer repeated queries, appropriate caching and compression. These are practical directions for reducing resource use. Treat environmental claims with care: transferred bytes or INP alone are not measurements of a site’s total energy use.
For Drupal teams, Gander performance tests can track database queries, cache operations and asset counts. Deterministic counts make useful assertions; timing thresholds are more variable. In a project configured for Drupal functional JavaScript tests and the Gander OpenTelemetry setup, run the documented test group from the Drupal web directory:
../vendor/bin/phpunit -c core --group OpenTelemetryThat command helps inspect CMS-side performance over time. It does not replace field INP data or a browser trace. WordPress teams can apply the same approach with their own application tracing and automated checks.
Make the improvement survive the next release
Give each accepted change a guardrail suited to its cause: an interaction test, a transfer budget, a reviewed third-party list or a cache assertion. Review the field trend after release, allowing for CrUX’s rolling window, and revisit the ticket if customers still experience the delay.
If separate performance, SEO and sustainability audits are competing for budget, Greg can help your team turn the evidence into one practical delivery backlog.
Related on GrN.dk
- JavaScript-Heavy Service Pages Still Lose Leads: What to Audit in 2026
- SEO Audit Checklist: What to Check—and Fix—First
- WordPress PageSpeed: What to Fix First for Better Core Web Vitals
Need help with this kind of work?
Talk to Greg about your digital backlog Get in touch with Greg.