By Greg Nowak. Last updated 2026-10-09.
Customers cannot complete their purchases, and your hosting provider needs to investigate the fault. But what should you send them? The time, the affected service and relevant log excerpts are a good place to start. Otherwise, the first part of troubleshooting is spent requesting information.
Could your business use this? nowa.dk sets up AI automation for Danish companies.
This is where AI automation can help: bring the alert, relevant evidence and suggested explanations together in a single ticket. The recipient should be able to see what actually happened, what remains uncertain and where the investigation should go next.
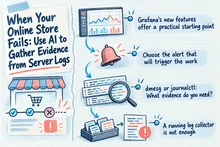
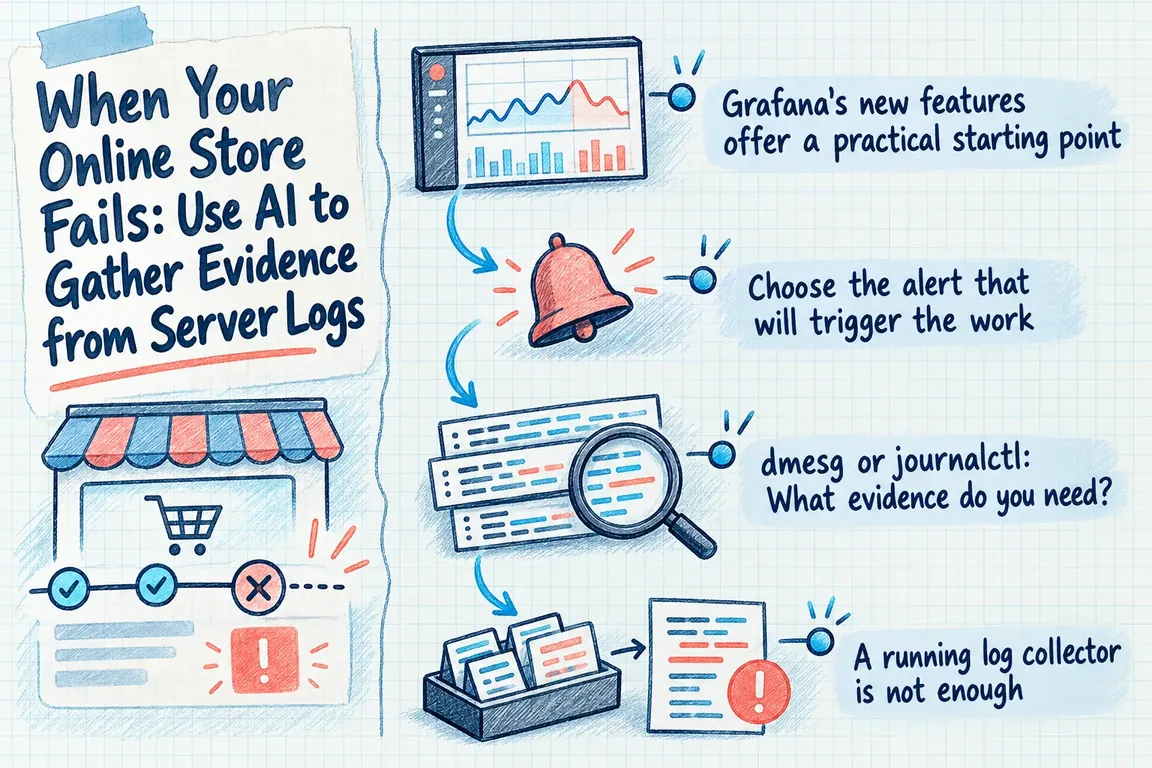
Grafana's new features offer a practical starting point
On 27 July 2026, Grafana announced the general availability of features including Assistant Investigations and Assistant Automations. Investigations can develop and test hypotheses about operational problems. Automations can run saved instructions repeatedly on a schedule or when triggered manually. Grafana describes this in its launch announcement.
For a Danish online store, a practical use for these features is to prepare for troubleshooting when monitoring detects a problem. Start with a ticket that the hosting provider or developer can verify. Any automated interventions should be a separate project once the investigation process has been tested.
Choose the alert that will trigger the work
Start with a symptom the business needs to respond to, such as an unavailable online store or checkout errors. Agree with the person responsible for operations which services the investigation should cover, who should receive the ticket and what the recipient needs to move forward. Those choices determine what the automation should collect.
Be precise about the consequences. A checkout error alone does not tell you how many orders the business has lost. If the impact on orders has not been investigated, the ticket should say so. Also agree on how repeated alerts about the same problem will be added to an existing ticket, so the recipient can follow events without piecing them together from several separate messages.
dmesg or journalctl: What evidence do you need?
dmesg reads the Linux kernel's ring buffer and is useful when you need to investigate kernel messages. You will not find all of the online store's service logs here. There is also a detail to bear in mind when placing events on a timeline: the official dmesg manual warns that timestamps converted to clock time can be inaccurate after suspend and resume.
journalctl reads the systemd journal. You can restrict the output to a service with -u and a time range with --since and --until. With -k, you can also retrieve kernel messages. The journal can therefore contain both service logs and kernel messages, as described in systemd's journalctl manual.
| What you want to investigate | Start here | What you need to check |
|---|---|---|
| What did the service log around the time of the alert? | journalctl -u with --since and --until |
Are the service's logs available in the journal? |
| Which kernel messages are available? | dmesg |
Are the timestamps suitable for correlating the events? |
| What did the kernel log in the journal? | journalctl -k |
Does the output cover the relevant boot and time period? |
| How does the automation retrieve journal data? | journalctl -o json |
Are the required fields included, and has sensitive information been filtered out? |
JSON output from journalctl provides a format for automated processing. Agree on which fields and timestamps the ticket should retain so the recipient can trace the evidence back to the original output. Before you choose a solution, the hosting provider also needs to confirm which log sources the business can access.
A running log collector is not enough
Grafana Alloy's loki.source.journal component can read the systemd journal and forward entries to other Loki components. It supports filtering by journal fields and adding labels. Once the rest of the pipeline is configured, this provides a practical route from the Linux server's journal to centralised log analysis.
Read access must be in place, however. According to Alloy's documentation, the component can start without errors yet collect zero journal entries if the Alloy user lacks the required group memberships. The default value for max_age is seven hours. It determines how far back from process startup the component reads; it does not indicate how long data is retained centrally.
Require a simple test at handover: a known log entry must arrive, the service must be identifiable, and it must be possible to retrieve the time window around a test alert. Only then have you confirmed that collection delivers the data the investigation needs.
AI's explanations must be verifiable
Grafana Assistant Investigations can examine logs, metrics, traces and profiles and deliver a structured report with hypotheses and source queries. The documentation for AI investigations also describes automated investigations triggered through alerts and IRM webhooks. In the IRM workflows described, a summary and a link are sent back to the incident or alert group.
Give the investigation a clear symptom, a time range and the affected services. Ask for supporting evidence for each hypothesis and for missing data to be stated explicitly. The report should distinguish between observations, possible causes and the next check to perform. If two events coincide, their connection needs to be investigated before one is identified as the cause of the other.
Someone else must be able to take over the ticket
The hosting provider or developer should be able to open the ticket and begin investigating. Use a consistent structure that includes the alert's time and time zone, the observed symptom, affected services and selected log excerpts. Include hypotheses with supporting evidence, a named person responsible for the next step, and a direct link or another clear way to access the underlying analysis. Also state which sources have been examined and which are missing.
If the business uses another ticketing system, connecting to it is a separate integration task. Agree on which information should go into which fields, who has access and how an existing ticket is updated. Grafana's investigation handles part of the work; the handover to the business's chosen system also needs to be designed and tested.
Select log excerpts that help the recipient understand the finding. Include enough context to assess it and access to the original if further investigation is needed. End the ticket with a specific investigation task, such as checking a particular service during the stated time range.
Filter sensitive information before forwarding it
Agree on which information may be sent for centralised analysis and then included in the ticket. If the logs contain access tokens, customers' email addresses or other sensitive values, these should be removed or masked before forwarding. The technical information needed for troubleshooting must still be present. Test the filtering with representative log excerpts.
Selecting the right services and masking log contents are two different tasks. Check both that the relevant entries are selected and that their contents are suitable for forwarding. At the same time, decide who may read the original logs, the AI report and the completed ticket.
Start with one alert and one recipient
An initial project can cover one alert type, the relevant services and one recipient. Agree on the success criteria before setup: how much manual collection remains? Can the recipient use the evidence? And does the ticket reach the right person responsible?
Test the entire workflow using an agreed test. The alert should trigger collection, the hypotheses should be verifiable, and the person responsible should be able to take over the ticket without first requesting basic information. Also test whether repeated alerts produce useful updates in the same ticket.
Through nowa.dk, his AI automation service for Danish businesses, Greg can help set up log collection, filter sensitive information and connect monitoring to a ticketing system. Start with a specific operational alert and an anonymised log excerpt. This makes it possible to define the scope with the business's operations provider and assess whether the workflow should later be extended to other parts of the online store.
Related on GrN.dk
- Hvad spørger kunderne om? Lad AI læse mønstrene i supporten
- Jeg bygger AI-agenter til små virksomheder. Jeg mangler en, der kan sælge dem.
- AI på bookingsiden: Hvad må den love kunden, før I taler sammen?
Need help with this kind of work?
Talk to Greg about AI automation for your online store's operations Get in touch with Greg.