By Greg Nowak. Updated 7 August 2026.
PHP debugging gets expensive when the team starts changing code before it understands the failure. A broken checkout, missing webhook, or blank administration page may need only a small fix, but every hour spent guessing increases downtime, delivery risk, and client frustration.
The practical goal is to shorten the path from “something is wrong” to reliable evidence. That means reproducing the problem, choosing visibility appropriate to the environment, recording only useful context, and escalating to a step debugger when simpler tools stop paying off.
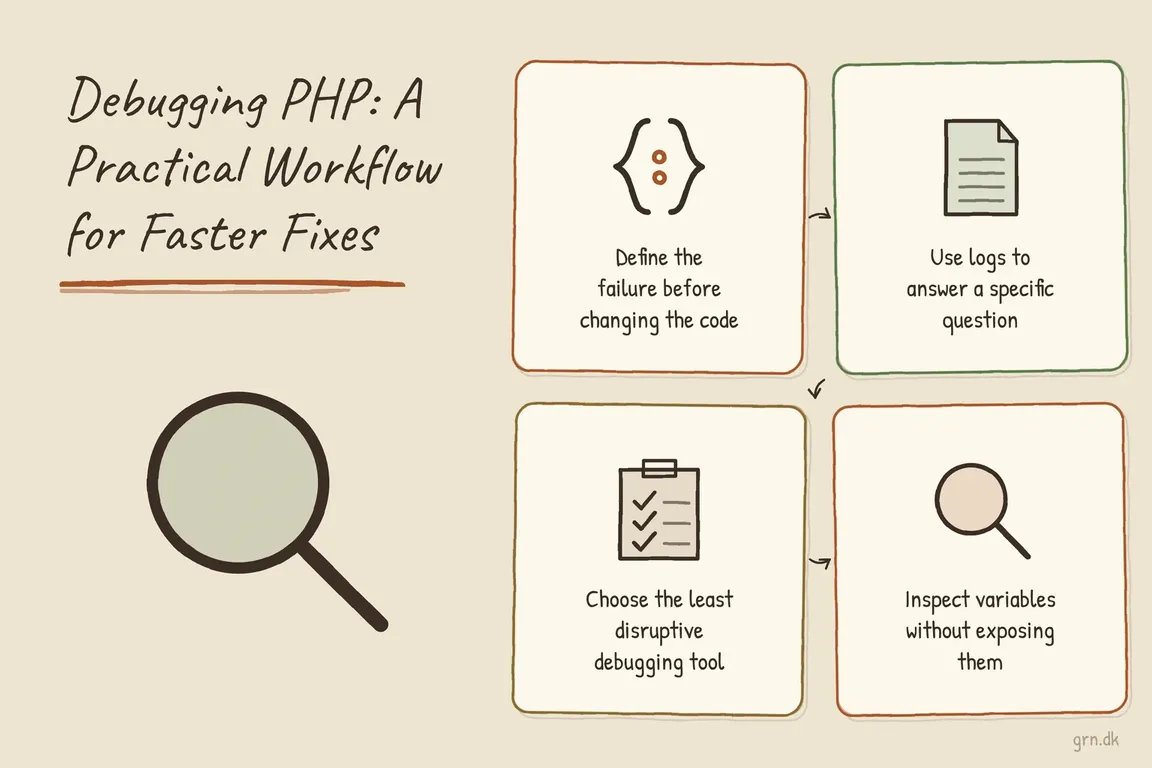
Define the failure before changing the code
Begin with a short incident description that another person can follow. Record the affected URL, command, queue, or integration; the expected and actual behaviour; when the problem began; and whether it affects every request or only particular accounts, inputs, or environments.
Then create the smallest repeatable case you can. Save a sanitized request body, note the order of actions, or isolate the failing command. Check recent deployments, configuration changes, dependency updates, and upstream service responses. This prevents a team from “fixing” an unrelated symptom while the original failure remains.
For production-only problems, do not experiment directly on arbitrary customer requests. Use request or correlation IDs to follow one known attempt through the application, web server, worker, and external integration.
Separate development visibility from production safety
In a local or restricted staging environment, set error reporting explicitly. This avoids relying on an old server image, hosting panel, or project default:
error_reporting = E_ALL
display_errors = On
display_startup_errors = On
log_errors = On
The same settings can be enabled at runtime for a narrow development investigation:
<?php
error_reporting(E_ALL);
ini_set('display_errors', '1');
?>
Runtime settings cannot reveal a parse error in the same file or another fatal failure that happens before those lines execute. For bootstrap and startup problems, change the relevant php.ini, PHP-FPM, web-server, container, or hosting configuration instead.
On public production systems, display nothing and log everything at the appropriate error level:
error_reporting = E_ALL
display_errors = Off
display_startup_errors = Off
log_errors = On
PHP’s production guidance favours logging over displaying errors. Raw errors can reveal paths, stack traces, configuration details, and business logic. If you configure a separate error_log file, confirm that the PHP process can write to it and that rotation, retention, and access permissions are managed. In container platforms, the existing SAPI or standard-error logging path is often easier to operate than an application-specific file.
Use logs to answer a specific question
A useful temporary log line should test a hypothesis: did the webhook arrive, which record was selected, which branch ran, or what status did the provider return? Include stable identifiers and decision points so related events can be followed without dumping an entire object.
<?php
error_log(sprintf(
    '[checkout] request_id=%s order_id=%s state=%s provider_status=%s',
    $requestId,
    $orderId,
    $state,
    $providerStatus
));
?>
Do not log access tokens, passwords, session cookies, payment details, or complete customer records. Even short-lived debug output can be copied into backups, observability systems, or agency support channels. If a secret is accidentally recorded, treat it as exposed: restrict access, remove retained copies where possible, and rotate the credential.
PHP’s error_log() can also append directly to a destination using message type 3. In that mode, PHP does not add a newline:
<?php
error_log(
    '[import] batch_id=' . $batchId . ' status=' . $status . PHP_EOL,
    3,
    '/path/outside-the-web-root/import-debug.log'
);
?>
Use direct-file logging only when the destination and permissions are controlled. The normal application or platform logger is usually a better long-term home.
Choose the least disruptive debugging tool
| What you know | Best first tool | What it should establish |
|---|---|---|
| A local page is blank | PHP error and startup-error configuration | Whether parsing, bootstrap, or runtime execution failed |
| A live request fails intermittently | Production logs with a request ID | Which request, branch, and dependency produced the failure |
| The code receives the wrong shape or type | A deliberate variable inspection | Whether input, mapping, or type handling is responsible |
| The path crosses middleware, events, hooks, or workers | Trigger-based Xdebug step debugging | The actual execution path and the point where state changes |
Inspect variables without exposing them
var_dump() remains useful because it shows both type and value, including nested arrays and objects. That distinction matters when request data arrives as strings, database values are nullable, or an API changes its response shape.
<?php
var_dump($payload);
?>
Use it locally or in a tightly controlled environment. If you need to capture the output for comparison, PHP’s output-control functions can turn it into a string:
<?php
ob_start();
var_dump($payload);
$dump = ob_get_clean();
?>
From there, send only a sanitized excerpt to a protected debug destination. Do not leave dumps in templates, API responses, public directories, or client-facing screenshots.
Use Xdebug when logs cannot explain the path
Xdebug earns its place when the failure depends on several layers of state: framework middleware, event subscribers, legacy includes, dependency injection, queue workers, or repeated transformations. Configure it in a development environment and activate sessions only when requested:
xdebug.mode=debug,develop
xdebug.start_with_request=trigger
For a command-line run:
XDEBUG_TRIGGER=1 php your-script.phpThe xdebug.mode setting belongs in php.ini or an Xdebug ini file loaded when PHP starts; reload the relevant PHP process after changing it. Xdebug also supports an XDEBUG_MODE environment override, but PHP-FPM and other server setups may filter environment variables. If the debugger does not connect, confirm the active configuration and network route before adding more breakpoints.
Finish with a safer system, not just a patch
After identifying the cause, make the smallest defensible fix and verify both the failing case and a normal path. Remove temporary logs and dumps, disable investigation-only settings, and confirm that no debug files are publicly reachable.
Then preserve the lesson as a regression test, validation rule, monitoring signal, deployment check, or short runbook entry. That is what turns one successful fix into lower operational risk for the next release.
If production-only failures, unclear handoffs, or fragile releases keep consuming agency time, Greg can help improve both the PHP debugging process and the delivery workflow around it.
Related on GrN.dk
- How to Check Whether a PHP Constant Is Defined (Without Breaking Production)
- NGINX 1.30 changed upstream connection reuse: what to check before you upgrade
- Cloudflare Service Keys Stop in September: Find Every Caller
Need help with this kind of work?
Discuss your PHP delivery workflow Get in touch with Greg.