By Greg Nowak. Updated 3 September 2026.
GitHub Copilot’s repository-level reporting closes an important visibility gap. Engineering leaders can now see which repositories have pull requests created by Copilot’s cloud agent, which receive Copilot code reviews, and whether Copilot-authored pull requests are subsequently merged.
That is useful, but it is not a productivity verdict. The metrics show where Copilot enters the workflow. They do not tell a business owner whether releases became faster, defects fell, or the additional consumption was worth paying for.
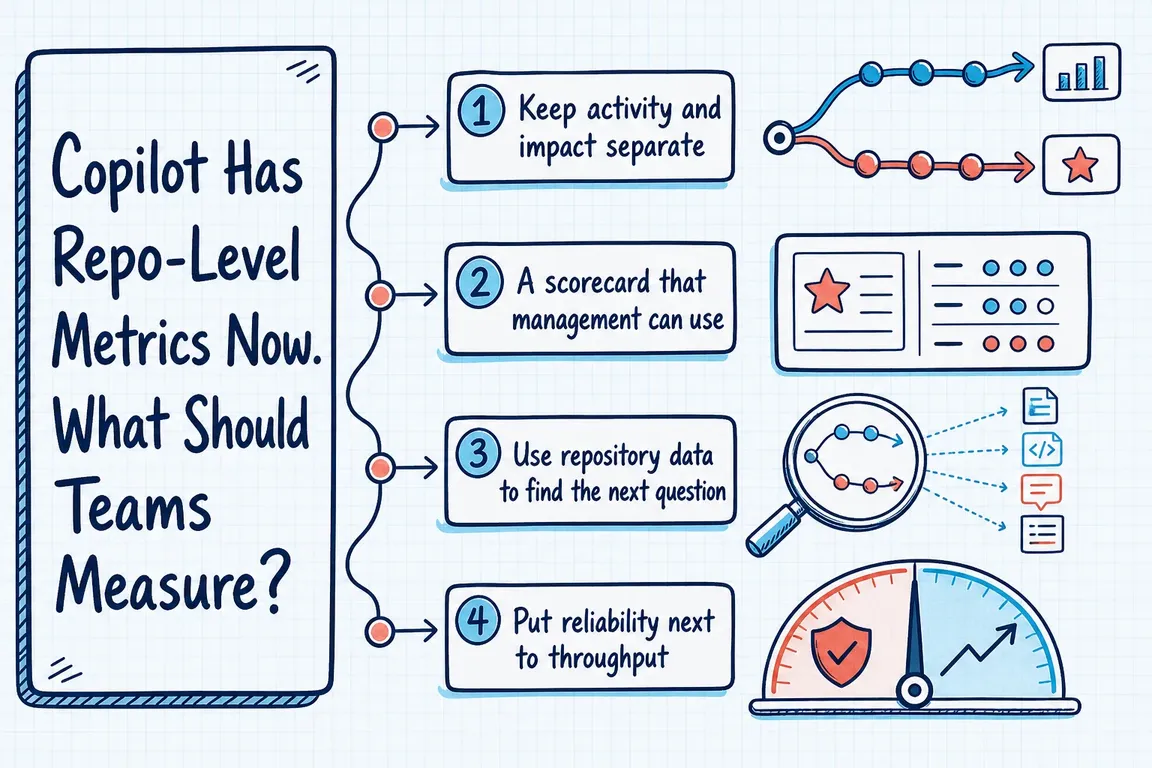
The right response is not a larger adoption dashboard. It is a small operational scorecard that puts Copilot activity beside delivery, quality and cost.
Start with what the GitHub data actually measures
GitHub’s usage metrics reference documents daily repository records for pull-request creation, review, merge and suggestion activity. These include pull requests created by Copilot cloud agent, pull requests reviewed by Copilot code review, and Copilot-created pull requests that were later merged.
The daily event rules matter. Creation and merge are each counted on the day they happen. A pull request reviewed on several days can be counted on each of those days. Repositories without pull-request activity on the requested day are omitted entirely.
Consequently, an absent repository row does not prove that nobody used Copilot there. Nor does dividing this week’s Copilot-created pull requests by this week’s merged Copilot-created pull requests produce a reliable conversion rate: the two events may describe different pull-request cohorts.
Use the supplied counts and medians as directional workflow signals. For cohort questions—such as how many agent-created changes were eventually accepted—join the report to pull-request-level delivery data.
A Copilot scorecard built for decisions
Every measure should help answer a management question. This matrix is a useful starting point:
| Decision question | Copilot signal | Evidence to add | Possible response |
|---|---|---|---|
| Are teams using the capability? | Active users and feature activity | Seats, team membership and rollout dates | Improve enablement or reconsider unused seats |
| Where does Copilot enter delivery? | Agent-created and Copilot-reviewed pull requests by repository | Repository type, risk level and task category | Expand or narrow the eligible work |
| Is work moving acceptably? | Merge counts and median time to merge | Lead time, first-review time and review cycles | Change task selection or review policy |
| Is quality staying within limits? | Review suggestions and applied suggestions | Failed checks, rework, rollbacks and incidents | Strengthen tests, gates or human review |
| Is the result worth its consumption? | AI credits used | Actions minutes and accepted delivery outcomes | Adjust budgets, runners or rollout scope |
Do not compare every repository as if it performs the same job. A documentation repository, an internal tool and a customer-facing payment service have different review requirements and failure costs. Segment by repository class or work type before comparing trends.
Build a reporting pipeline you can audit
The organization endpoint documented in GitHub’s current REST API reference follows this pattern: GET /orgs/{org}/copilot/metrics/reports/repos-1-day?day=YYYY-MM-DD. An equivalent enterprise endpoint is available for enterprise-scoped reporting.
A practical pipeline should:
- Request each completed day and promptly download the returned NDJSON files; GitHub supplies signed download links with limited lifetimes.
- Store the untouched source file with its report day, extraction time and scope.
- Use the stable repository ID for joins, while retaining the repository name for display.
- Join repository activity to pull-request, CI, incident and cost data already available to the team.
- Publish weekly or rolling multi-week views while preserving the underlying daily records.
Show numerators and denominators together. A 100% rate based on one event is operationally different from the same rate across sustained activity. Mark null medians, sparse samples, policy changes and missing data instead of silently converting them to zero.
Also keep organization and enterprise views distinct. GitHub’s metrics guidance explains that attribution and user deduplication can produce different totals at different scopes. Pick one scope for trend reporting and document it.
Put cost beside code review
Copilot code review now has two consumption components. According to GitHub’s billing documentation, model use consumes AI credits while the agentic infrastructure consumes GitHub Actions minutes. Tracking only one can understate the operational cost.
The per-user ai_credits_used field is useful for consumption analysis, but GitHub explicitly says it is not an invoicing total and does not break usage down by feature, model or surface. Keep the operational scorecard and finance reconciliation separate, even if they appear in the same reporting workspace.
Review the scorecard as a decision meeting
A monthly review should end with an action: expand Copilot to suitable repositories, improve test coverage first, tighten review controls, change budgets, or stop delegating a particular class of task. Raw activity growth is not an action and should not become the target.
If your Copilot data currently lives apart from delivery and cost reporting, Greg can help define the decisions, connect the relevant APIs and build a scorecard your technical and commercial stakeholders can both use. Talk to Greg about your reporting setup.
Related on GrN.dk
- Google Review Link Generators: What Small Teams Actually Need
- Your AI Visibility Dashboard Needs a Methodology, Not More Charts
- AI automations need a spend dashboard before the first runaway bill
Need help with this kind of work?
Build a useful Copilot scorecard with Greg Get in touch with Greg.