By Greg Nowak. Last updated 2026-07-17.
Air quality in Northern Thailand is not merely a travel concern. For a business owner, operations lead, or agency team, smoke can disrupt site visits, outdoor production, staff wellbeing, transport, accommodation, and client plans.
The useful question is not whether Chiang Mai is “safe” for an entire month. Conditions change by hour, day, and location. Treat air quality as an operating variable: monitor reliable data, decide in advance what different conditions will change, and maintain a credible indoor fallback.
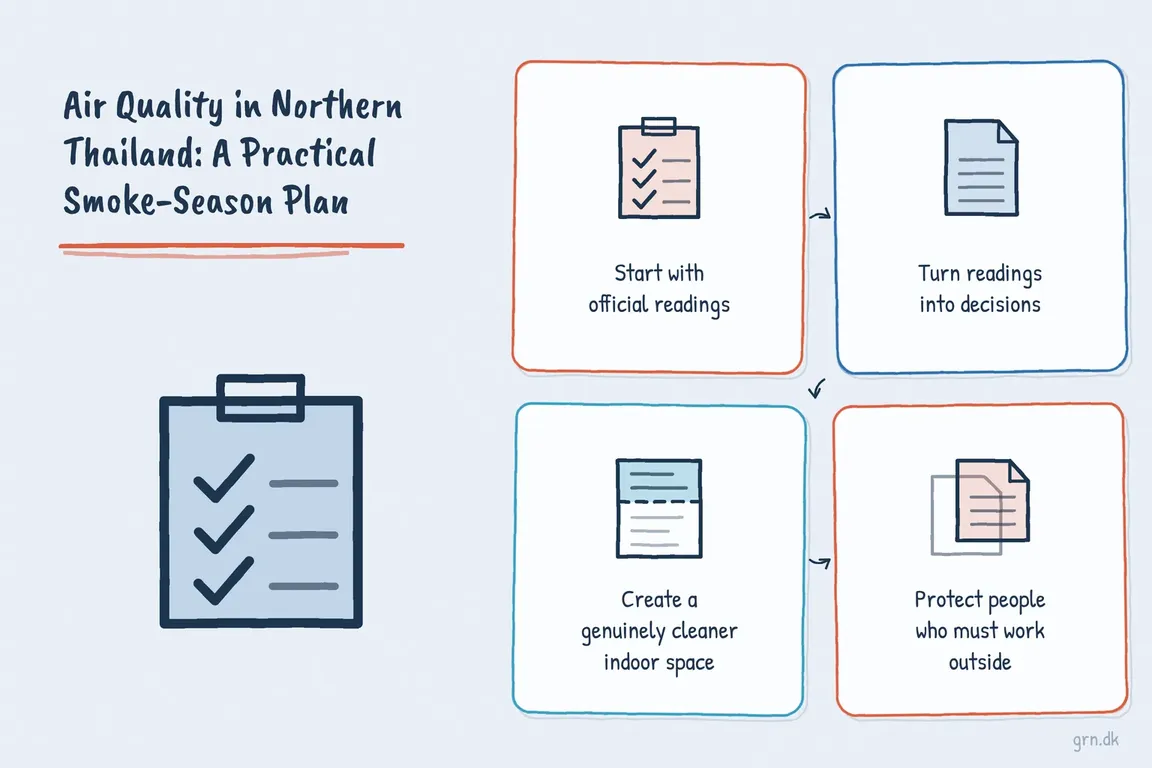
Start with official readings
Use Air4Thai, operated by Thailand’s Pollution Control Department, for official monitoring-station data. Check the station nearest to where people will actually work or stay rather than relying on a city-wide screenshot or a photograph of the skyline.
Read the figures carefully. PM2.5 is the measured concentration of fine particles in the air, normally expressed in micrograms per cubic metre. AQI is a unitless index that translates measurements from PM2.5 and other pollutants into colour-coded health categories.
They are not interchangeable. Thailand’s Pollution Control Department explains that the prominent PM2.5 figure in Air4Thai is a 24-hour average, updated hourly. The hourly chart shows shorter-term movement. The average helps describe accumulated conditions, while the hourly trend can reveal whether the air is improving or deteriorating before an outdoor activity.
Add NASA FIRMS for regional context. It provides near-real-time satellite detections of fires and other thermal anomalies. A detection is not a street-level air-quality reading, nor does it prove that smoke will reach your location. Wind, terrain, atmospheric mixing, and observation times all matter. Use FIRMS to understand the wider pattern, not to overrule the nearest monitor.
Turn readings into decisions
A dashboard is only useful if it changes what you do. Assign one person to check Air4Thai before the working day and again before substantial outdoor activity. Their update should include the nearest reading, the recent direction of travel, the planned response, and the next review time.
| Signal | Operational response | Preparation required |
|---|---|---|
| Conditions are acceptable and stable | Continue the plan and favour earlier outdoor work where practical | Keep monitoring and confirm that the indoor fallback remains available |
| Readings are worsening | Shorten strenuous activity and move flexible shoots, tours, or meetings indoors | Run air cleaners, close outside-air intakes where appropriate, and brief participants |
| Official guidance indicates unhealthy conditions | Postpone non-essential outdoor work and use remote or indoor plans | Activate the cleaner-air room and reduce unnecessary travel exposure |
| A vulnerable person reports symptoms or concern | Follow their health plan and seek appropriate medical advice; do not wait for the group trigger | Know the nearby care options and allow individual opt-outs without friction |
Avoid one rigid threshold for everyone. Children, older adults, pregnant people, and people with heart or lung conditions can face greater risk from smoke. The World Health Organization’s guidance reflects evidence of health effects at lower pollution concentrations than previously understood. Visibility and smell are therefore poor substitutes for measurement.
Create a genuinely cleaner indoor space
“We will stay inside” is not a complete plan if outdoor air leaks freely into the building. Before booking accommodation or workspace, ask whether windows and doors close properly, whether air conditioning can recirculate indoor air, and whether there is enough space and electrical capacity for portable air cleaners.
Identify at least one bedroom or workroom that can become a cleaner-air room. US Environmental Protection Agency guidance recommends keeping its doors and windows closed, avoiding activities that create particles, and using a portable air cleaner correctly sized for the room. Run it continuously when conditions are poor if the manufacturer permits, and avoid cleaners that intentionally produce ozone.
If a compatible central HVAC system is available, the EPA recommends a high-efficiency filter—often MERV 13 or higher—and running the fan more frequently. Confirm compatibility first: installing a filter that the system cannot handle may reduce airflow. Set systems to recirculate where possible rather than drawing smoky air inside.
Do not undermine filtration by producing more indoor pollution. During heavy smoke, avoid smoking, candles, incense, aerosol sprays, frying, broiling, and unnecessary vacuuming without a HEPA-filtered machine.
Protect people who must work outside
Reschedule, relocate, or shorten outdoor tasks before relying on personal protective equipment. When essential work must continue, a correctly worn, well-fitting, certified particulate respirator such as a NIOSH-approved N95 or P100 can reduce exposure to PM2.5, smoke, and ash particles.
A cloth covering or loose surgical mask is not equivalent. Tight-fitting respirators need to seal around the face; facial hair, incorrect strap placement, and a poor nose seal reduce their effectiveness. Disposable particulate respirators also do not protect against gases or vapours. Employers should follow applicable workplace safety rules, while anyone with heart or lung concerns should obtain appropriate medical advice.
Make bookings easier to change
Smoke-season resilience is partly a procurement problem. Prefer flexible accommodation and transport, indoor venues with effective filtration, and schedules that let outdoor work move to another day. If filming, surveying, events, or site work depend on visibility and prolonged outdoor activity, allow contingency time rather than assuming every booked day will be usable.
- Use historical seasonality when choosing dates, but make day-to-day decisions from current readings.
- Check the precise location against nearby monitors; “outside Chiang Mai” does not automatically mean cleaner air.
- Ask venues specific questions about filtration, closed windows, room capacity, and backup power.
- Give staff and guests a written bad-air-day plan, including who makes the decision and how changes are communicated.
- Review conditions before deposits become non-refundable and again before people travel.
The aim is not perfect prediction. It is a calm operating system built around trusted inputs, named ownership, proportionate actions, and reversible plans. If you are arranging a retreat, seasonal base, production, or client programme in Northern Thailand, Greg can help turn those moving parts into a practical brief and delivery plan. Talk to Greg about the project.
Related on GrN.dk
- AI agents need a browser policy before they start clicking around
- Drupal Wiki: Build a Knowledge Base People Can Actually Use
- Form Spam Is a Lead-Quality Problem: A Practical Hardening Playbook
Need help with this kind of work?
Plan the project with Greg Get in touch with Greg.