By Greg Nowak. Last updated 2026-10-17.
When a website slows down during a campaign, knowing that HTTP/2 is enabled only answers part of the question. You still need to find where requests are waiting before you can decide what to change.
HTTP/2 allows multiple streams on one connection. The amount of application work your server can handle at once depends on the rest of the stack. Follow the affected request from the browser through the reverse proxy and, where applicable, Apache and PHP-FPM. That gives you a way to investigate the slowdown without guessing at capacity settings.
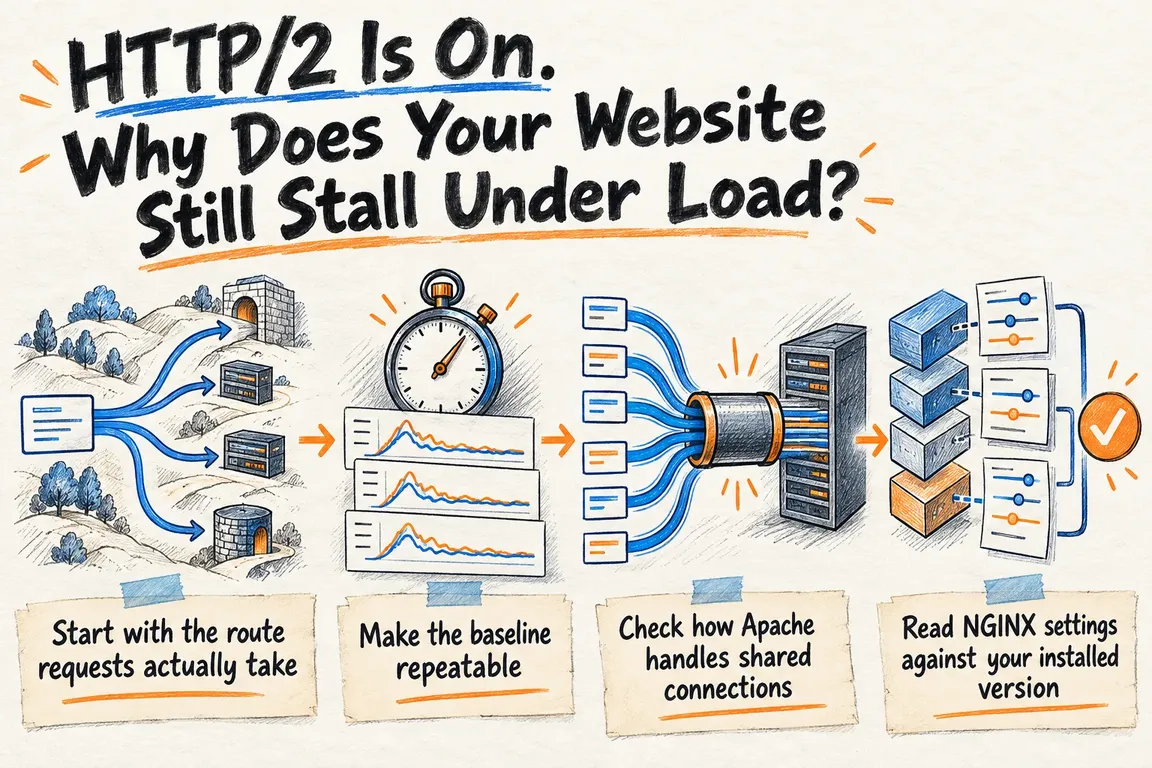
Start with the route requests actually take
Sketch the deployed stack before changing any limits. If NGINX receives browser traffic and forwards it to Apache, those are separate connections. If it sends PHP requests directly to PHP-FPM, Apache has no role in that request path. Note the installed versions, active configuration and where cached responses are served.
Choose two representative requests: a confirmed cache hit that avoids PHP execution, and a dynamic request that reaches PHP-FPM. Comparing them helps narrow the investigation. A difference in performance still needs evidence from the relevant server component before you can assign a cause.
| Part of the request path | Controlled comparison | Evidence needed |
|---|---|---|
| Browser connection | Compare protocols, then test higher HTTP/2 stream counts separately. | Negotiated protocol, client count and stream settings for each run. |
| NGINX reverse proxy | Compare confirmed cache hits with requests forwarded upstream. | Installed version, effective connection-reuse settings and upstream timings. |
| Apache workers | Repeat the affected request mix while watching worker activity. | Active MPM, occupied workers and available memory. |
| PHP-FPM | Increase concurrent dynamic requests in measured steps. | Pool limit, status observations and slow-request traces. |
Make the baseline repeatable
A useful baseline is one someone else can reproduce. Record the URL, cache state, request headers, software versions and test-machine location. Use a read-only request with a known expected response. For a live service, agree on the test window and stopping conditions before applying load.
The h2load benchmarking guide covers concurrent clients (-c), maximum concurrent streams per client (-m), total requests (-n), test duration and warm-up time. You can force HTTP/1.1 with --h1 and select the TLS protocol with --alpn-list. Results include request timings, throughput, failures and status-code counts.
Start the protocol comparison with one stream per client. Keep the client count, duration and endpoint the same for each protocol. Then test HTTP/2 multiplexing by increasing streams while holding the client count steady. Changing these separately makes the results easier to interpret.
Run both stages against the cached and dynamic responses, keeping a run sheet as you go. Check that successful responses contain the expected content. Fast error pages tell you very little about the site's ability to serve the workload that matters.
Check how Apache handles shared connections
Apache documents a restriction worth checking early: with the prefork multiprocessing module, mod_http2 processes one request at a time per connection. A slow request can hold up other requests on that connection. The Apache HTTP/2 guide recommends the event MPM where the setup supports it.
Check which MPM is active and whether the application supports a change. Apache notes that prefork may be needed for processing engines that cannot handle multithreading. Moving to another MPM needs compatibility validation.
Record worker activity and memory use alongside the load-test timeline. You need enough evidence to distinguish that per-connection restriction from a broader shortage of processing capacity. The remedies depend on which constraint you actually observe.
Read NGINX settings against your installed version
An upstream keepalive value in NGINX describes cached idle connections per worker. It does not limit the total connections that worker can open to upstream servers. Seeing keepalive 32 in a configuration therefore tells you nothing on its own about a 32-request backend capacity limit.
Version matters here. The NGINX upstream documentation states that, from 1.29.7, upstream keepalive caching is enabled by default, with 32 cached connections per worker and reuse local to each location. HTTP proxying also defaults to HTTP/1.1 from that version. Check explicit configuration on earlier deployments; those defaults cannot be assumed.
FastCGI has a separate requirement: fastcgi_keep_conn must be enabled for keepalive reuse. Inspect HTTP proxying and FastCGI forwarding according to the route the affected request takes.
Look at PHP-FPM capacity and slow requests together
PHP-FPM's pm.max_children sets how many simultaneous requests a pool can serve. Its static, dynamic and ondemand modes control how child processes are maintained. The PHP-FPM configuration manual defines these settings.
That manual also documents two useful diagnostic options. request_slowlog_timeout captures backtraces of slow requests. pm.status_listen allows status requests to be served independently when the main pool is busy. Both can help you see what is happening during a controlled test.
Before increasing the child limit, measure process memory under representative work and check how much memory the server has available. Read the slow traces alongside pool activity. There are two decisions to make: whether the server has room for more concurrent execution, and which requests need to finish sooner. A pool size copied from an unrelated configuration example answers neither.
Give each change a question to answer
Suppose the cached request stays responsive while the dynamic request slows. Follow the dynamic path next, checking whether the slowdown coincides with Apache activity, upstream connection behaviour or FPM pool saturation. The comparison gives you a direction; it does not establish that PHP-FPM is responsible.
If both requests slow down, examine the path they share. Also check that the test generator can sustain the intended workload. Keep plausible explanations open until the measurements let you rule them out.
Make one targeted change, record why you made it and repeat the baseline. Agree on success before the repeat test: acceptable response times, expected response content and a failure threshold at the tested concurrency. Include the busiest relevant request type in those acceptance criteria.
The report should show the observed constraint, the evidence behind it and the before-and-after results. It should also say what remains untested. A business owner can then decide whether to approve configuration changes, commission application work or fund more capacity, with a clear understanding of what the test supports.
Put a clear scope around the investigation
If a campaign or recurring traffic peak is exposing these delays, ask Greg at GrN.dk to scope a server-performance investigation. The work should cover a reproducible baseline, worker and memory analysis, targeted configuration changes and a repeat test.
You should come away knowing where requests wait, what improved under the tested load and what still needs attention. That gives the next infrastructure decision a measurable basis.
Related on GrN.dk
- NGINX Can Read JSON Before Routing—Should It Handle Your AI API?
- Apache 2.4.68 Isn’t the Only Number That Proves You’re Patched
- Before You Buy a GPU: Test Your Team’s Local AI Workload
Need help with this kind of work?
Discuss a server-performance investigation Get in touch with Greg.